I’m reading Wayne Au’s (2023) Unequal by Design: High Stakes Testing and the Standardization of Inequality, a short (140 pages) overview of how our capitalist education system in the US perpetuates inequities, using testing to turn students into commodities. It’s dramatic at times – Au sets the stage with testing as a monster to be slayed (e.g., p. xii) – but I’ve been looking for a good summary of the Marxist, critical-theory, anti-testing perspective, and this seems to fit.
While slayers of testing often oversimplify and misconstrue their enemy, I was surprised to see this basic distortion of test design (p. 78, emphasis in original).
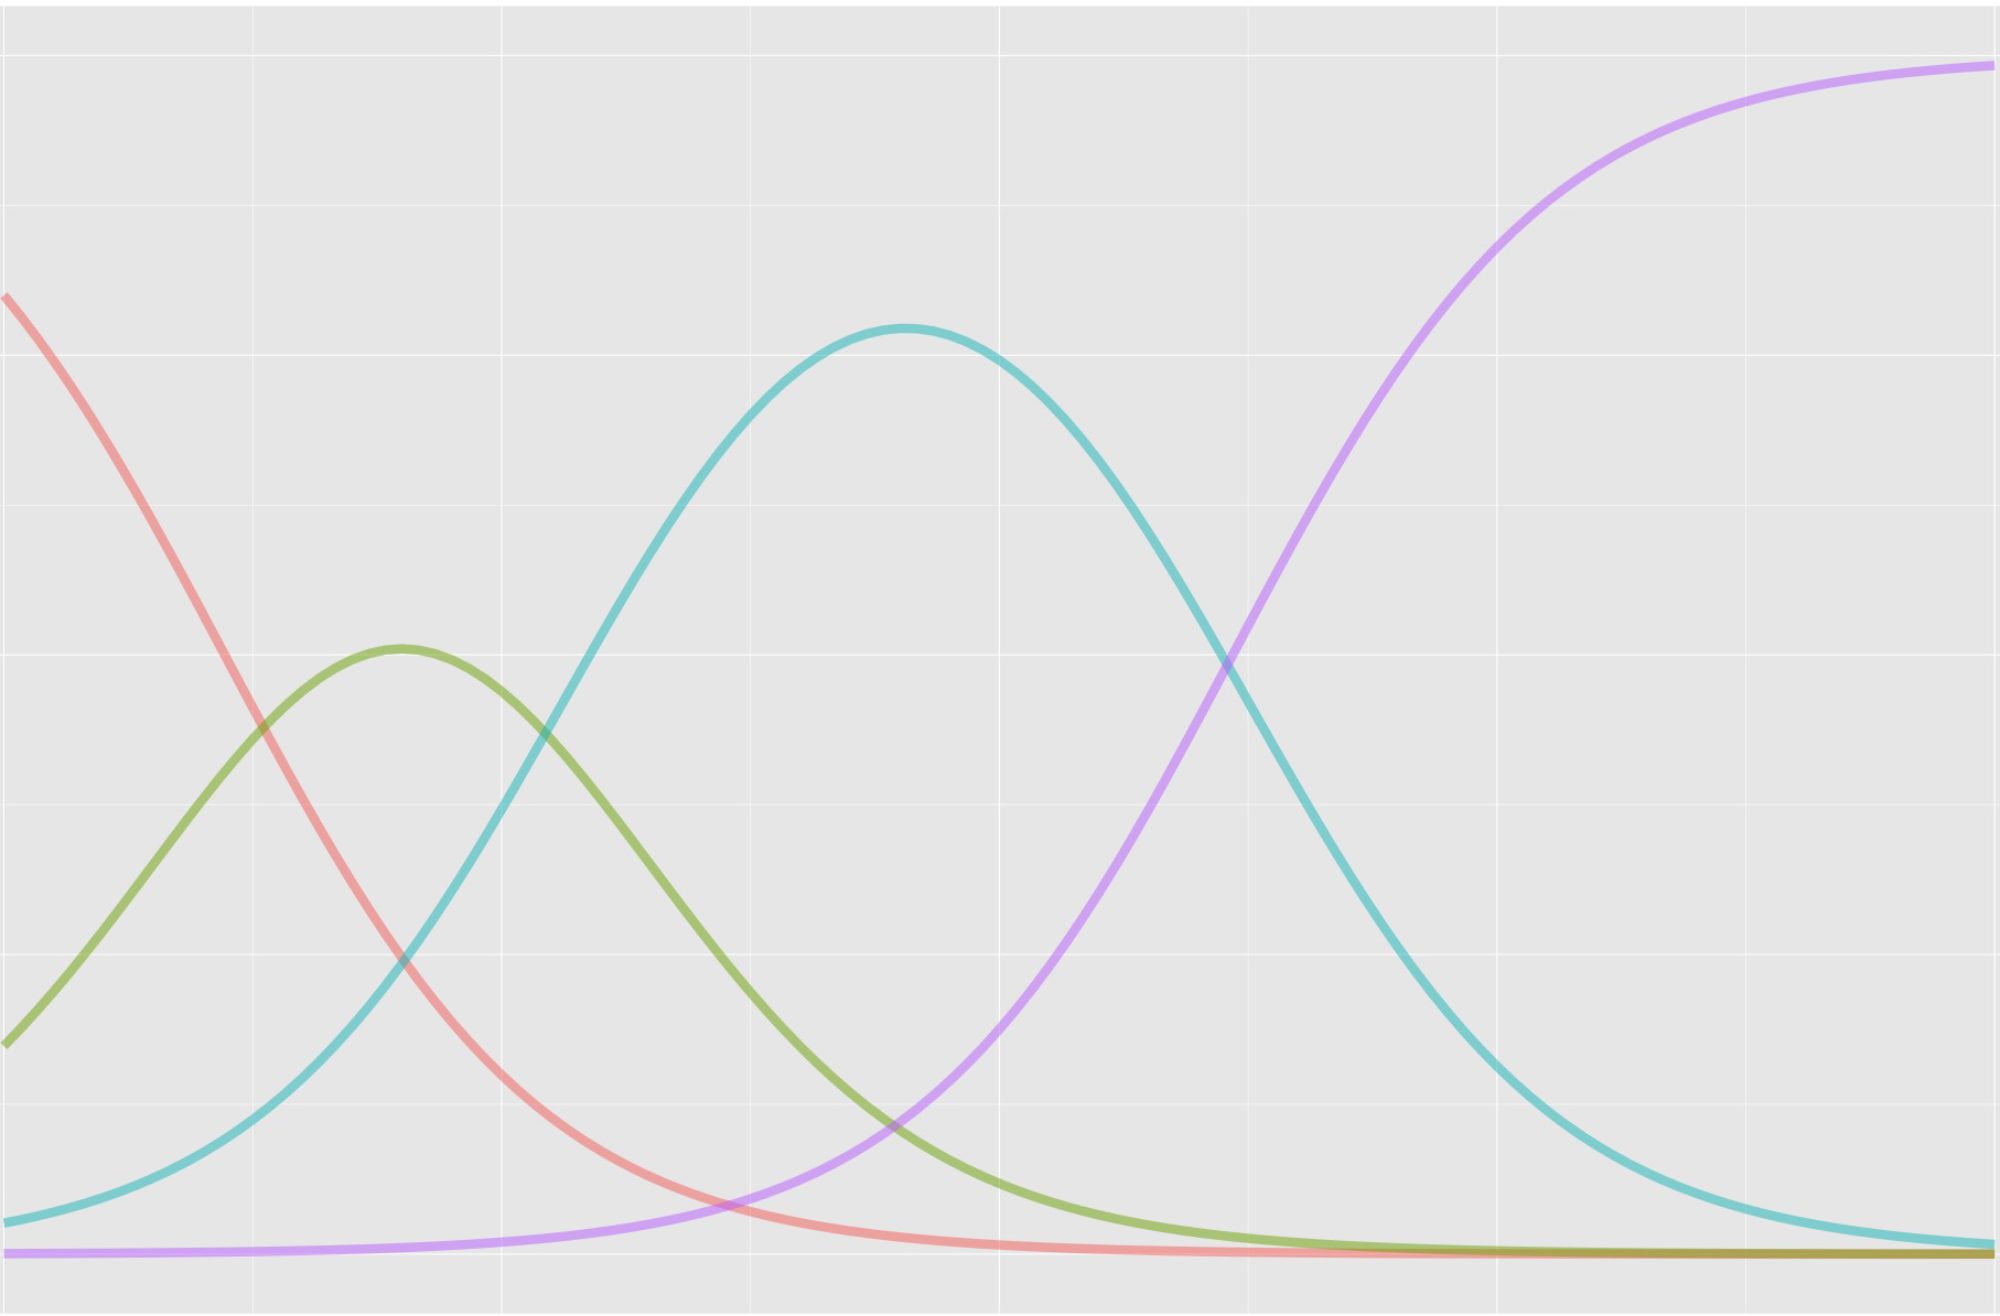
At the root of this is the fact that all standardized tests are designed to produce what’s called a “bell curve” – what test makers think of as a “normal distribution” of test scores (and intelligence) across the human population. In a bell curve most students get average test scores (the “norm”), with smaller numbers of students getting lower or higher scores. If you look at this graphically, you would see it as a bell shape, where the students getting average scores make up the majority – or the hump – of the curve (Weber, 2015, 2016). Standardized tests are considered “good” or valid if they produce this kind of bell curve, and the data from all of them, even standard’s based exams [sic], are “scaled” to this shape (Tan & Michel, 2011). Indeed, this issue is the reason I titled this book, Unequal By Design, because at their core – baked into the very assumptions at the heart of their construction – standardized tests are designed to produce inequality.
I think I know what Au is getting at here. Tests designed for norm referencing (e.g., selection, ranking, prediction) are optimized when there is variability in scores – if everyone does well or everyone does poorly on the test, scores are bunched up, and it’s harder to make comparisons. So, technically, norm referencing does benefit from inequality.
But this ignores the simple fact that state accountability testing, which is the main focus of the book, isn’t designed solely for normative comparisons. In fact, the primary use of state testing is comparison to performance standards. Norms can also be applied, but, since they aren’t designed for comparison among test takers, state tests aren’t tied to inequality in results. Au distinguishes between norm and criterion referencing earlier in the book (p. 10) but not here, when it really matters.
Au gives three references here, none of which support the claim that test scores must be bell shaped to be valid. Tan and Michel (2011) is an explainer from ETS that says nothing about transforming to a curve. It’s an overview of scaling and equating, which are used to put scores from different test forms onto a common scale for reporting purposes. The Weber references (2015, 2016) are two blog posts that also don’t prove that scores have to be normally distributed, with variation, to be valid. The posts do show lots of example score distributions that are roughly bell shaped, but this is to demonstrate how performance standards can be moved around to produce different pass rates even though the shapes of score distributions don’t change.
Weber (2015) makes the same mistake that Au did, uncritically referencing Tan and Michel (2011) as evidence that test developers intentionally craft bell curves.
After grading, items are converted from raw scores to scale scores; here’s a neat little policy brief from ETS on how and why that happens. Between the item construction, the item selection, and the scaling, the tests are all but guaranteed to yield bell-shaped distributions.
It’s true that tests designed for norm referencing will gravitate toward content, methods, and procedures that increase variability in scores, because higher variability improves precision in score comparisons. But this doesn’t guarantee a certain shape – uniform and skewed distributions could also work well – and, more importantly, the Tan and Michel reference doesn’t support this point at all.
I assume Au and Weber don’t have any good references here because there aren’t any. State tests aren’t “normalized” as Weber (2016) claims. Rescaling and equating aren’t normalizing. If they produce normal distributions, it’s probably because what state tests are measuring is actually normally distributed. Regardless, the best source of evidence for state testing having inequality “baked into the very assumptions at the heart of their construction” (Au, see above) would be the publicly available technical documentation on how the tests are actually constructed, and the book doesn’t go there.
References
Au, W. (2023). Unequal by design: High-stakes testing and the standardization of inequality. New York, NY: Routledge.
Tan, X., & Michel, R. (2011). Why do standardized testing programs report scaled scores? Why not just report the raw or precent-correct scores? ETS R&D Connections, 16. https://www.ets.org/Media/Research/pdf/RD_Connections16.pdf
Weber, M. (2015, September 25). Common core testing: Who’s the real “liar”? Jersey Jazzman. https://jerseyjazzman.blogspot.com/2015/09/common-core-testing-whos-real-liar.html
Weber, M. (2016, April 27). The PARCC silly season. Jersey Jazzman. https://jerseyjazzman.blogspot.com/2016/04/the-parcc-silly-season.html
