University of California (UC) faculty are hoping to un-cancel standardized testing for undergraduate admissions. Some math and STEM faculty circulated a letter earlier this month (2000+ signatures) and social science and humanities faculty started their own letter soon after (800+ signatures). I signed the second letter.
My argument for testing – no surprise – goes like this:
- Tests aren’t perfect, but neither are personal statements or extracurriculars, and the costs of testing are outweighed by the benefits of having at least one standardized metric in admissions.
- Criticisms of testing are mostly exaggerated and/or not presented in good faith – tests never were the only factor, you can request fee waivers, there’s lots of free test prep now, etc.
- The UC was using testing responsibly until it was canceled in 2020, and we can expect they’ll continue to do so if we bring it back.
I say more in an article from 2021. Here’s a summary of some other commentaries. And there are lots of other good articles and books on the topic.
When the testing debates were happening in 2020, my general response was – let’s try it and see what happens, maybe we can get by without it. Well, preliminary results are in and the test-free admissions experiment seems to have failed.
The faculty letters are short and worth a quick read. Both are available at https://ucstudentsuccess.org. In essence, incoming undergraduate students are increasingly unprepared for college work and UC faculty argue that testing will help admit students who are less unprepared. Reinstating the SAT/ACT in California (from now on I’ll just say SAT) might also help document and discourage grade inflation, where students pass high school classes without having mastered the content.
UC San Diego reported on this issue in November 2025. Here’s an excerpt from the executive summary.
Over the past five years, UC San Diego has experienced a steep decline in the academic preparation of its entering first-year students – particularly in mathematics, but also in writing and language skills. Between 2020 and 2025, the number of students whose math skills fall below high school level increased nearly thirtyfold; moreover, 70% of those students fall below middle school levels, reaching roughly one in twelve members of the entering cohort. This deterioration coincided with the COVID-19 pandemic and its effects on education, the elimination of standardized testing, grade inflation, and the expansion of admissions from under-resourced high schools. The combination of these factors has produced an incoming class increasingly unprepared for the quantitative and analytical rigor expected at UC San Diego.
The numbers from UC San Diego are pretty alarming. Placement into the lowest remedial math class has increased from 0.5% of students (32 of 6,449) in 2020 to 8.5% (665 of 7,799) in 2025. That’s an increase from 1 of 200 to 1 out of every 12 students.
The report concludes that, “Admitting large numbers of underprepared students risks harming those students and straining limited instructional resources.”
Some disagree that testing is the answer. In a San Francisco Chronicle opinion article (June 10, 2026, paywalled), Jonathan Glater, law professor at UC Berkeley, says that declines in math and reading predate 2020 and aren’t the result of test-free admissions. That may be true, but it doesn’t mean testing won’t help with our current selection and placement predicaments.
Glater also claims that if we reintroduce testing, it will dominate the admissions process.
But revisiting the decision to abandon the SAT is not the right response. The reasons for that decision have not changed. Bringing the SAT back would elevate one variable — that test’s scores — above other variables that matter, in the name of reducing the number of students whose math preparation is too weak.
This is a common misconception about admission testing, perhaps the most common that I’ve seen. In UC holistic review, testing isn’t elevated above other variables. It’s one source of information among many. Under required testing before 2020, only one of the nine UC campuses with undergraduate admissions had a weighting system for test scores, the rest did not, and we have no evidence that any campus elevated testing above other variables. It’s not clear why this would suddenly become a problem now.
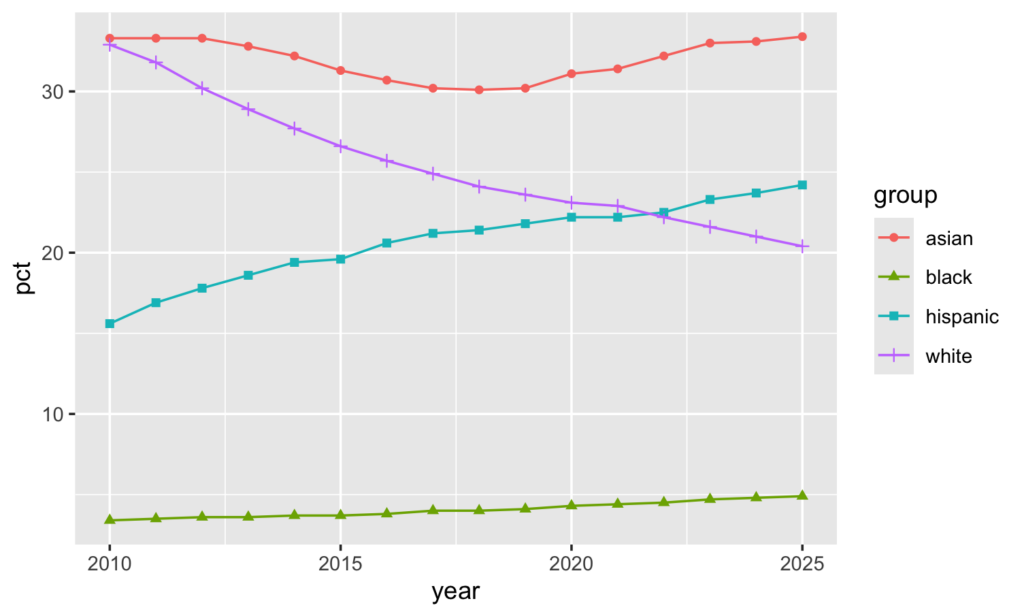
Glater and others are right that diversity has increased since testing was canceled. UC enrollment trends show the percentage of incoming students who are Black has increased to 4.9% for fall 2025, up from 4.3% in fall 2020 when testing was last required. The White student percentage decreased to 20.4% from 23.1% over the same period. Percentages increased from 31.1 to 33.4% for Asian students and from 22.2 to 24.2% for Hispanic students.
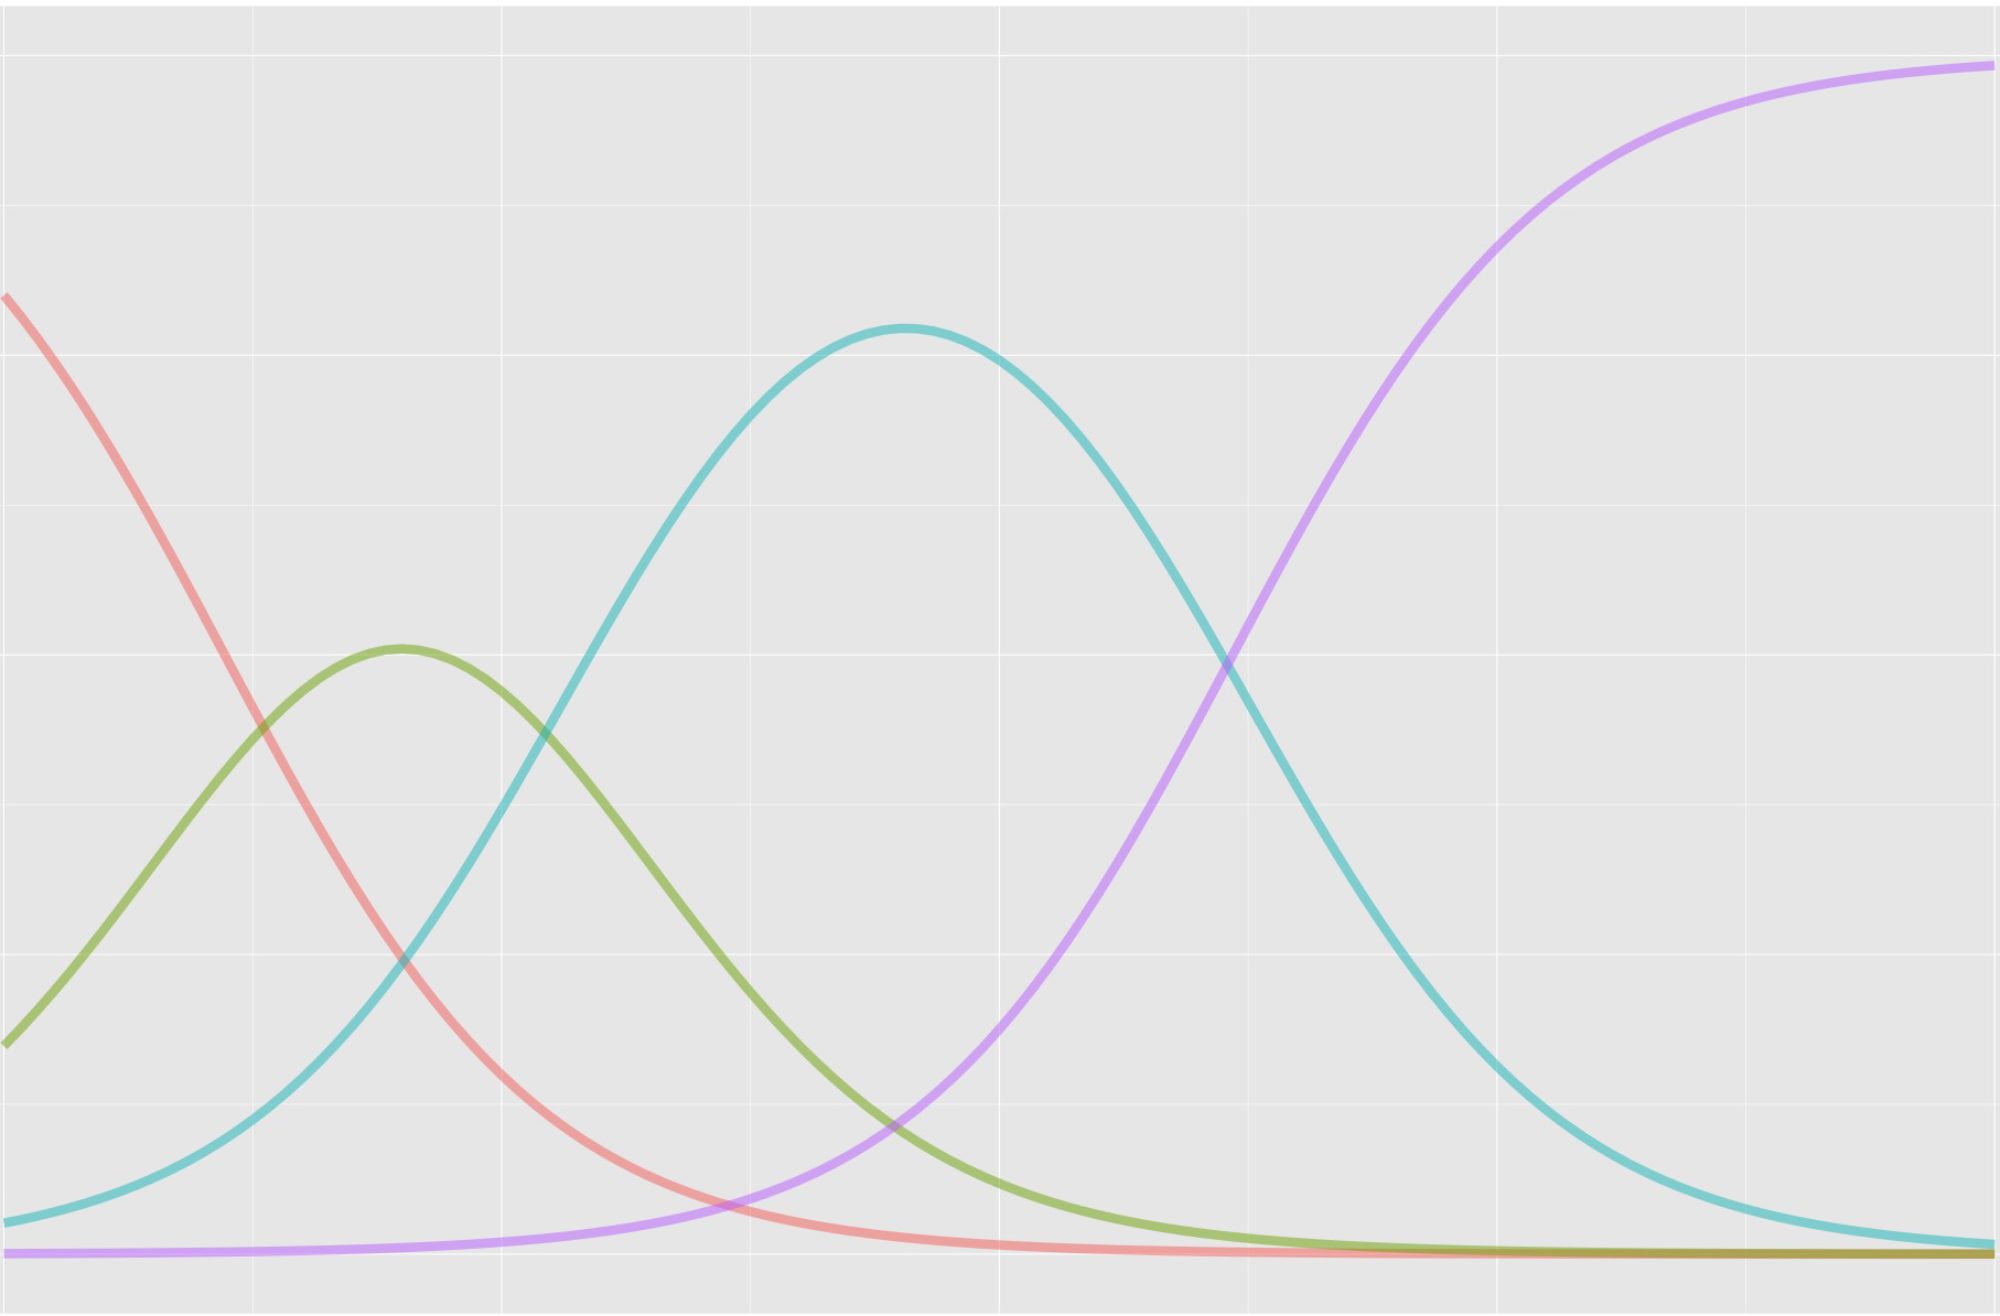
But diversity was increasing before testing was canceled. These trends extend back to 2010 and beyond. Asian students fare as well without testing as with it. White students have trended down regardless. Black and Hispanic students have been increasing regardless. Here’s a chart based on UC data (same link as above) showing trends from 2010 to 2025 (excluding unknown and groups with percentages below 1).
So, removing testing hasn’t necessarily helped improve diversity, but it has made admissions more difficult. The facts are – we know that test scores correlate positively with college outcomes, and that the correlation for GPA will decrease as GPA loses precision. The UC San Diego report shows that GPA is already giving us less information about who’s ready for college. Test scores, as was always the intent, can serve as an important cross-check on grades.
A simple initial solution would be for the state to cover the cost of an existing test for anyone who wants to take it. Testing could also be required for all 11th graders, as is the case in other states. We would then need to increase access to test practice and preparation resources. Beyond this, the Standardized Testing Task Force report from 2020 has some good suggestions for testing and admissions and the UC San Diego report has recommendations specific to the grade inflation issue and the challenges it presents for placement and remediation.