Article on Intersectional DIF in Applied Measurement in Education

Brian French, Thao Thu Vo, and I recently (February, 2024) published an open-access paper in Applied Measurement in Education on Traditional vs Intersectional DIF Analysis: Considerations and a Comparison Using State Testing Data.

https://doi.org/10.1080/08957347.2024.2311935

The paper extends research by Russell and colleagues (e.g., 2021) on intersectional differential item functioning (DIF).

Here’s our abstract.

Recent research has demonstrated an intersectional approach to the study of differential item functioning (DIF). This approach expands DIF to account for the interactions between what have traditionally been treated as separate grouping variables. In this paper, we compare traditional and intersectional DIF analyses using data from a state testing program (nearly 20,000 students in grade 11, math, science, English language arts). We extend previous research on intersectional DIF by employing field test data (embedded within operational forms) and by comparing methods that were adjusted for an increase in Type I error (Mantel-Haenszel and logistic regression). Intersectional analysis flagged more items for DIF compared with traditional methods, even when controlling for the increased number of statistical tests. We discuss implications for state testing programs and consider how intersectionality can be applied in future DIF research.

We refer to intersectional DIF as DIF with interaction effects, partly to highlight the methodology – which builds on traditional DIF as an analysis of main effects – and to distinguish it as one piece of a larger intersectional perspective on the item response process. We don’t get into the ecology of item responding (Zumbo et al., 2015), but that’s the idea – traditional DIF just scratches the surface.

A few things keep DIF analysis on the surface.

  1. More complex analysis would require larger sample sizes for field/pilot testing. We’d have to plan and budget for it.
  2. Better analysis would also require a theory of test bias that developers may not be in a position to articulate. This brings in the debate on consequential validity evidence – who is responsible for investigating test bias, and how extensive does analysis need to be?
  3. Building on 2, only test developers have ready access to the data needed for DIF analysis. Other researchers and the public, who might have good input, aren’t involved. I touch on this idea in a previous post.

References

Albano, T., French, B. F., & Vo, T. T. (2024). Traditional vs intersectional DIF analysis: Considerations and a comparison using state testing data. Applied Measurement in Education, 37(1), 57-70. https://doi.org/10.1080/08957347.2024.2311935

Russell, M., & Kaplan, L. (2021). An intersectional approach to differential item functioning: Reflecting configurations of inequality. Practical Assessment, Research & Evaluation, 26(21), 1-17.

Zumbo, B. D., Liu, Y., Wu, A. D., Shear, B. R., Olvera Astivia, O. L., & Ark, T. K. (2015). A methodology for Zumbo’s third generation DIF analyses and the ecology of item responding. Language Assessment Quarterly, 12(1), 136-151. https://doi.org/10.1080/15434303.2014.972559

Differential Item Functioning in the Smarter Balanced Test

In class last fall, we reviewed the Smarter Balanced (SB) technical report for examples of how validity evidence is collected and documented, including through differential item functioning (DIF) analysis.

I teach and research DIF, but I don’t often inspect operational results from a large-scale standardized test. Results for race/ethnicity showed a few unexpected trends. Here’s a link to the DIF section of the 2018/2019 technical report.

https://technicalreports.smarterbalanced.org/2018-19_summative-report/_book/test-fairness.html#differential-item-functioning-dif

The report gives an overview of the Mantel-Haenszel method, and then shows, for ELA/literacy and math, numbers of items from the test bank per grade and demographic variable that fall under each DIF category.

  • The NA category is for items that didn’t have enough valid responses, for a given comparison (eg, female vs male), to estimate DIF. Groups with smaller sample sizes had more items with NA.
  • A, B, C are the usual Mantel-Haenszel levels of DIF, where A is negligible, B is moderate, and C is large. Testing programs, including SB, focus on items at level C and mostly leave A and B alone.
  • The +/- indicates the direction of the DIF, where negative is for items that favor the reference group (eg, male) or disadvantage the focal group (eg, female), and positive is for items that do the opposite, favor the focal group or disadvantage the reference group.

The SB report suggests that DIF was conducted at the field test stage, where items weren’t yet operational. But the results tables say “DIF items in the current summative pool,” which makes it sound like they include operational items. I’m not sure how this worked.

ELA

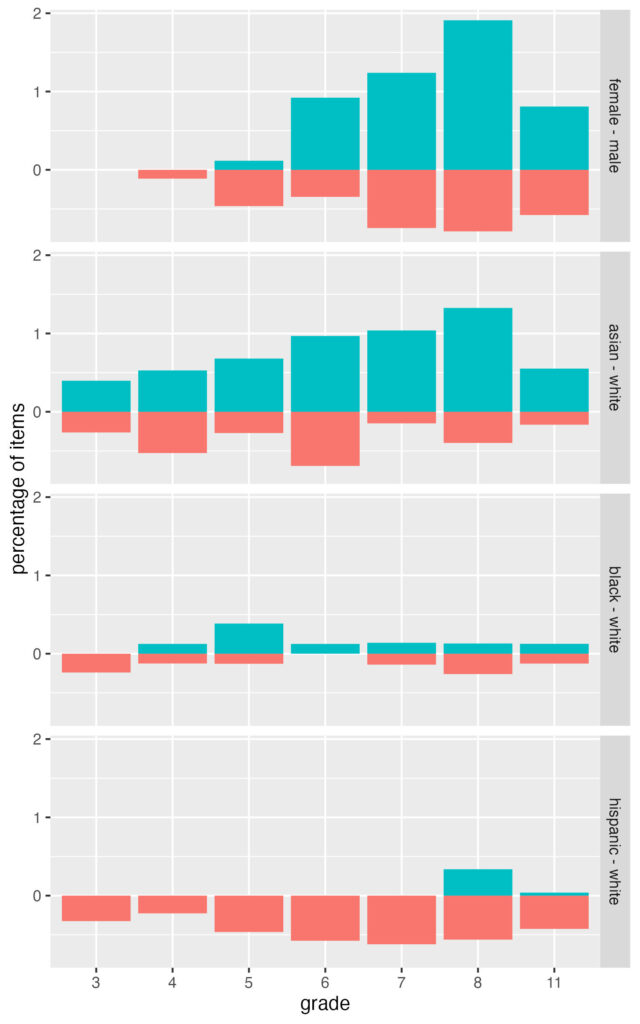
Here’s a bar chart that summarizes level C DIF by grade for ELA in a subset of demographic comparisons. The blueish bars going up are percentages of items with C+ DIF (favoring focal group) and the redish bars going down are for C- (favoring reference). The groups being compared are labeled on the right side.

Smarter Balanced 2018/2019 DIF results, percentages of items with level C DIF for ELA/literacy

I’m using percentages instead of counts of items because the number of items differs by grade (under 1,000 in early grades, over 2,000 in grade 11), and the number of items with data for DIF analysis varies by demographic group (some groups had more NA than others). Counts would be more difficult to compare. These percentages exclude items in the NA category.

For ELA, we tend to see more items favoring female (vs male) and asian (vs white) students. There doesn’t seem to be a trend for black and white students, but there are more items favoring white students when compared with hispanic (almost none). In some groups, we also see a slight increase for later grades, but a decrease at grade 11.

Math

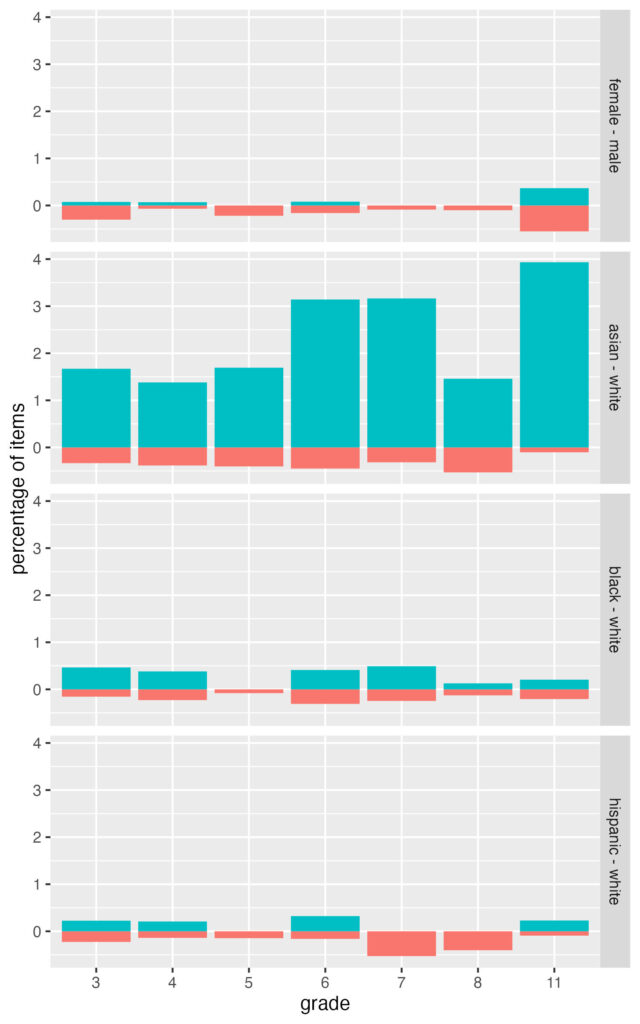
Here’s the same chart but for math items. Note the change in y-axis (now maxing at 4 percent instead of 2 for ELA) to accommodate the increase in DIF favoring asian students (vs white). Other differences from ELA include slightly more items favoring male students (vs female), and more balance in results for black and white students, and hispanic and white students.

DIF in grades 6, 7, and 11 reaches 3 to 4% of items favoring asian students. Converting these back to counts, the total numbers of items with data for DIF analysis are 1,114, 948, and 966 in grades 6, 7, and 11, respectively, and the numbers of C+ DIF favoring asian students are 35, 30, and 38.

Conclusions

These DIF results are surprising, especially for the math test, but I’d want some more information before drawing conclusions.

First, what was the study design supporting the DIF analysis? The technical report doesn’t describe how and when data were collected. Within a given grade and demographic group, do these results accumulate data from different years and different geographic locations? If so, how were forms constructed and administered? Were field test items embedded within the operational adaptive test? And how were results then linked?

Clarifying the study design and scaling would help us understand why so many items had insufficient sample sizes for estimating DIF analysis, and why these item numbers in the NA category differed by grade and demographic group. Field test items are usually randomly assigned to test takers, which would help ensure numbers of respondents are balanced across items.

Finally, the report leaves out some key details on how the Mantel-Haenszel DIF analysis was conducted. We have the main equations, but we don’t have information about what anchor/control variable was used (eg, total score vs scale score), whether item purification was used, and how significance testing factored into determining the DIF categories.

More issues in the difR package for differential item functioning analysis in R

I wrote last time about the difR package (Magis, Beland, Tuerlinckx, & De Boeck, 2010) and how it doesn’t account for missing data in Mantel-Haenszel DIF analysis. I’ve noticed two more issues as I’ve continued testing the package (version 5.1).

  1. The problem with Mantel-Haenszel also appears in the code for the standardization method, accessed via difR:::difStd, which calls difR:::stdPDIF. Look there and you’ll see base:::length used to obtain counts (e.g., number of correct/incorrect for focal and reference groups at a given score level). Missing data will throw off these counts. So, difR standardization and MH are only recommended with complete data.
  2. In the likelihood ratio method, code for pseudo $R^2$ (used as a measure of DIF effect size) can lead to errors for some models. The code also seems to assume no missing data. More on these issues below.

DIF with the likelihood ratio method is performed using the difR:::difLogistic function, which ultimately calls difR:::Logistik to do the modeling (via glm) and calculate the $R^2$. The functions for calculating $R^2$ are embedded within the difR:::Logistik function.

R2 <- function(m, n) {
  1 - (exp(-m$null.deviance / 2 + m$deviance / 2))^(2 / n)
}
R2max <- function(m, n) {
  1 - (exp(-m$null.deviance / 2))^(2 / n)
}
R2DIF <- function(m, n) {
  R2(m, n) / R2max(m, n)
}

These functions capture $R^2$ as defined by Nagelkerke (1991), which is a modification to Cox and Snell (1989). When these are run via difR:::Logistik, the sample size n argument is set to the number of rows in the data set, which ignores missing data on a particular item. So, n will be inflated for items with missing data, and $R^2$ will be reduced (assuming a constant deviance).

In addition to the missing data issue, because of the way they’re written, these functions stretch the precision limits of R. In the R2max function specifically, the model deviance is first converted to a log-likelihood, and then a likelihood, before raising to 2/n. The problem is, large deviances correspond to very small likelihoods. A deviance of 500 gives us a likelihood of 7.175096e-66, which R can manage. But a deviance of 1500 gives us a likelihood of 0, which produces $R^2 = 1$.

The workaround is simple – avoid calculating likelihoods by rearranging terms. Here’s how I’ve written them in the epmr package.

r2_cox <- function(object, n = length(object$y)) {
  1 - exp((object\$deviance - object\$null.deviance) / n)
}
r2_nag <- function(object, n = length(object$y)) {
  r2_cox(object, n) / (1 - exp(-object$null.deviance / n))
}

And here are two examples that compare results from difR with epmr and DescTools. The first example shows how roughly 10% missing data reduces $R^2$ by as much as 0.02 when using difR. Data come from the verbal data set, included in difR.

# Load example data from the difR package
# See ?difR:::verbal for details
data("verbal", package = "difR")

# Insert missing data on first half of items
set.seed(42)
np <- nrow(verbal)
ni <- 24
na_index <- matrix(
  sample(c(TRUE, FALSE), size = np * ni / 2,
    prob = c(.1, .9), replace = TRUE),
  nrow = np, ncol = ni / 2)
verbal[, 1:(ni / 2)][na_index] <- NA

# Get R2 from difR
# verbal[, 26] is the grouping variable gender
verb_total <- rowSums(verbal[, 1:ni], na.rm = TRUE)
verb_difr <- difR:::Logistik(verbal[, 1:ni],
  match = verb_total, member = verbal[, 26],
  type = "udif")

# Fit the uniform DIF models by hand
# To test for DIF, we would compare these with base
# models, not fit here
verb_glm <- vector("list", ni)
for (i in 1:ni) {
  verbal_sub <- data.frame(y = verbal[, i],
    t = verb_total, g = verbal[, 26])
  verb_glm[[i]] <- glm(y ~ t + g, family = "binomial",
    data = verbal_sub)
}

# Get R2 from epmr and DescTools packages
verb_epmr <- sapply(verb_glm, epmr:::r2_nag)
verb_desc <- sapply(verb_glm, DescTools:::PseudoR2,
  which = "Nag")

# Compare
# epmr and DescTools match for all items
# difR matches for the last 12 items, but R2 on the
# first 12 are depressed because of missing data
verb_tab <- data.frame(item = 1:24,
  pct_na = apply(verbal[, 1:ni], 2, epmr:::summiss) / np,
  difR = verb_difr$R2M0, epmr = verb_epmr,
  DescTools = verb_desc)

This table shows results for items 9 through 16, the last four items with missing data and the first four with complete data.

item pct_na difR epmr DescTools
9 0.089 0.197 0.203 0.203
10 0.085 0.308 0.318 0.318
11 0.139 0.408 0.429 0.429
12 0.136 0.278 0.293 0.293
13 0.000 0.405 0.405 0.405
14 0.000 0.532 0.532 0.532
15 0.000 0.370 0.370 0.370
16 0.000 0.401 0.401 0.401
Some results from first example

The second example shows a situation where $R^2$ in the difR package comes to 1. Data are from the 2009 administration of PISA, included in epmr.

# Prep data from epmr::PISA09
# Vector of item names
rsitems <- c("r414q02s", "r414q11s", "r414q06s",
  "r414q09s", "r452q03s", "r452q04s", "r452q06s",
  "r452q07s", "r458q01s", "r458q07s", "r458q04s")

# Subset to USA and Canada
pisa <- subset(PISA09, cnt %in% c("USA", "CAN"))

# Get R2 from difR
pisa_total <- rowSums(pisa[, rsitems],
  na.rm = TRUE)
pisa_difr <- difR:::Logistik(pisa[, rsitems],
  match = pisa_total, member = pisa$cnt,
  type = "udif")

# Fit the uniform DIF models by hand
pisa_glm <- vector("list", length(rsitems))
for (i in seq_along(rsitems)) {
  pisa_sub <- data.frame(y = pisa[, rsitems[i]],
    t = pisa_total, g = pisa$cnt)
  pisa_glm[[i]] <- glm(y ~ t + g, family = "binomial",
    data = pisa_sub)
}

# Get R2 from epmr and DescTools packages
pisa_epmr <- sapply(pisa_glm, epmr:::r2_nag)
pisa_desc <- sapply(pisa_glm, DescTools:::PseudoR2,
  which = "Nag")

# Compare
pisa_tab <- data.frame(item = seq_along(rsitems),
  difR = pisa_difr$R2M0, epmr = pisa_epmr,
  DescTools = pisa_desc)

Here are the resulting $R^2$ for each package, across all items.

item difR epmr DescTools
1 1 0.399 0.399
2 1 0.268 0.268
3 1 0.514 0.514
4 1 0.396 0.396
5 1 0.372 0.372
6 1 0.396 0.396
7 1 0.524 0.524
8 1 0.465 0.465
9 1 0.366 0.366
10 1 0.410 0.410
11 1 0.350 0.350
Results from second example

References

Cox, D. R. & Snell, E. J. (1989). The analysis of binary data. London: Chapman and Hall.

Magis, D., Beland, S, Tuerlinckx, F, & De Boeck, P. (2010). A general framework and an R package for the detection of dichotomous differential item functioning. Behavior Research Methods, 42, 847-862.

Nagelkerke, N. J. D. (1991). A note on a general definition of the coefficient of determination. Biometrika, 78, 691-692.

Issues in the difR Package Mantel-Haenszel Analysis

I’ve been using the difR package (Magis, Beland, Tuerlinckx, & De Boeck, 2010) to run differential item functioning (DIF) analysis in R. Here’s the package on CRAN.

https://cran.r-project.org/package=difR

I couldn’t get my own code to match the Mantel-Haenszel (MH) results from the difR package and it looks like it’s because there’s an issue in how the difR:::difMH function handles missing data. My code is on GitHub.

https://github.com/talbano/epmr/blob/master/R/difstudy.R

The MH DIF method is based on counts for correct vs incorrect responses in focal vs reference groups of test takers across levels of the construct (usually total scores). The code for difR:::difMH uses the length of a vector that is subset with logical indices to get the counts of test takers in each group. But missing data here will return NA in the logical comparisons, and NA isn’t omitted from length.

I’m pasting below the code from difR:::mantelHaenszel, which is called by difR:::difMH to run the MH analysis. Lines 19 to 33 all use length to find counts. This works fine with complete data, but as soon as someone has NA for an item score, captured in data[, item], they’ll figure into the count regardless of the comparisons being examined.

function (data, member, match = "score", correct = TRUE, exact = FALSE, 
    anchor = 1:ncol(data)) 
{
    res <- resAlpha <- varLambda <- RES <- NULL
    for (item in 1:ncol(data)) {
        data2 <- data[, anchor]
        if (sum(anchor == item) == 0) 
            data2 <- cbind(data2, data[, item])
        if (!is.matrix(data2)) 
            data2 <- cbind(data2)
        if (match[1] == "score") 
            xj <- rowSums(data2, na.rm = TRUE)
        else xj <- match
        scores <- sort(unique(xj))
        prov <- NULL
        ind <- 1:nrow(data)
        for (j in 1:length(scores)) {
            Aj <- length(ind[xj == scores[j] & member == 0 & 
                data[, item] == 1])
            Bj <- length(ind[xj == scores[j] & member == 0 & 
                data[, item] == 0])
            Cj <- length(ind[xj == scores[j] & member == 1 & 
                data[, item] == 1])
            Dj <- length(ind[xj == scores[j] & member == 1 & 
                data[, item] == 0])
            nrj <- length(ind[xj == scores[j] & member == 0])
            nfj <- length(ind[xj == scores[j] & member == 1])
            m1j <- length(ind[xj == scores[j] & data[, item] == 
                1])
            m0j <- length(ind[xj == scores[j] & data[, item] == 
                0])
            Tj <- length(ind[xj == scores[j]])
            if (exact) {
                if (Tj > 1) 
                  prov <- c(prov, c(Aj, Bj, Cj, Dj))
            }
            else {
                if (Tj > 1) 
                  prov <- rbind(prov, c(Aj, nrj * m1j/Tj, (((nrj * 
                    nfj)/Tj) * (m1j/Tj) * (m0j/(Tj - 1))), scores[j], 
                    Bj, Cj, Dj, Tj))
            }
        }
        if (exact) {
            tab <- array(prov, c(2, 2, length(prov)/4))
            pr <- mantelhaen.test(tab, exact = TRUE)
            RES <- rbind(RES, c(item, pr$statistic, pr$p.value))
        }
        else {
            if (correct) 
                res[item] <- (abs(sum(prov[, 1] - prov[, 2])) - 
                  0.5)^2/sum(prov[, 3])
            else res[item] <- (abs(sum(prov[, 1] - prov[, 2])))^2/sum(prov[, 
                3])
            resAlpha[item] <- sum(prov[, 1] * prov[, 7]/prov[, 
                8])/sum(prov[, 5] * prov[, 6]/prov[, 8])
            varLambda[item] <- sum((prov[, 1] * prov[, 7] + resAlpha[item] * 
                prov[, 5] * prov[, 6]) * (prov[, 1] + prov[, 
                7] + resAlpha[item] * (prov[, 5] + prov[, 6]))/prov[, 
                8]^2)/(2 * (sum(prov[, 1] * prov[, 7]/prov[, 
                8]))^2)
        }
    }
    if (match[1] != "score") 
        mess <- "matching variable"
    else mess <- "score"
    if (exact) 
        return(list(resMH = RES[, 2], Pval = RES[, 3], match = mess))
    else return(list(resMH = res, resAlpha = resAlpha, varLambda = varLambda, 
        match = mess))
}

Here’s a very simplified example of the issue. The vector 1:4 is in place of the ind object in the mantelHaenszel function (created on line 17). The vector c(1, 1, NA, 0) is in place of data[, item] (e.g., on line 20). One person has a score of 0 on this item, and two have scores of 1, but length returns count 2 for item score 0 and 3 for item score 1 because the NA is not removed by default.

length((1:4)[c(1, 1, NA, 0) == 0])
## [1] 2
length((1:4)[c(1, 1, NA, 0) == 1])
## [1] 3

With missing data, the MH counts from difR:::mantelHaenszel will all be padded by the number of people with NA for their item score. It could be that the authors are accounting for this somewhere else in the code, but I couldn’t find it.

Here’s what happens to the MH results with some made up testing data. For 200 people taking a test with five items, I’m giving a boost on two items to 20 of the reference group test takers (to generate DIF), and then inserting NA for 20 people on one of those items. MH stats are consistent across packages for the first DIF item (item 4) but not the second (item 5).

# Number of items and people
ni <- 5
np <- 200

# Create focal and reference groups
groups <- rep(c("foc", "ref"), each = np / 2)

# Generate scores
set.seed(220821)
item_scores <- matrix(sample(0:1, size = ni * np,
  replace = T), nrow = np, ncol = ni)

# Give 20 people from the reference group a boost on
# items 4 and 5
boost_ref_index <- sample((1:np)[groups == "ref"], 20)
item_scores[boost_ref_index, 4:5] <- 1

# Fix 20 scores on item 5 to be NA
item_scores[sample(1:np, 20), 5] <- NA

# Find total scores on the first three items,
# treated as anchor
total_scores <- rowSums(item_scores[, 1:3])

# Comparing MH stats, chi square matches for item 4
# with no NA but differs for item 5
epmr:::difstudy(item_scores, groups = groups,
  focal = "foc", scores = total_scores, anchor_items = 1:3,
  dif_items = 4:5, complete = FALSE)
## 
## Differential Item Functioning Study
## 
##   item  rn  fn r1 f1 r0 f0   mh  delta delta_abs chisq chisq_p ets_level
## 1    4 100 100 61 52 39 48 1.50 -0.946     0.946  1.58  0.2083         a
## 2    5  88  92 55 40 33 52 2.06 -1.701     1.701  4.84  0.0278         c
difR:::difMH(data.frame(item_scores), group = groups,
  focal.name = "foc", anchor = 1:3, match = total_scores)
## 
## Detection of Differential Item Functioning using Mantel-Haenszel method 
## with continuity correction and without item purification
## 
## Results based on asymptotic inference 
##  
## Matching variable: specified matching variable 
##  
## Anchor items (provided by the user): 
##    
##  X1
##  X2
##  X3
## 
##  
## No p-value adjustment for multiple comparisons 
##  
## Mantel-Haenszel Chi-square statistic: 
##  
##    Stat.  P-value  
## X4 1.5834 0.2083   
## X5 4.8568 0.0275  *
## 
## Signif. codes: 0 '***' 0.001 '**' 0.01 '*' 0.05 '.' 0.1 ' ' 1  
## 
## Detection threshold: 3.8415 (significance level: 0.05)
## 
## Items detected as DIF items: 
##    
##  X5
## 
##  
## Effect size (ETS Delta scale): 
##  
## Effect size code: 
##  'A': negligible effect 
##  'B': moderate effect 
##  'C': large effect 
##  
##    alphaMH deltaMH  
## X4  1.4955 -0.9457 A
## X5  1.8176 -1.4041 B
## 
## Effect size codes: 0 'A' 1.0 'B' 1.5 'C' 
##  (for absolute values of 'deltaMH') 
##  
## Output was not captured!

One more note, when reporting MH results, the difR package only uses the absolute delta values to assign ETS significance levels (A, B, C). You can see this in the difR:::print.MH function (not shown here). Usually, the MH approach also incorporates the p-value for the chi square (Zwick, 2012).

References

Magis, D., Beland, S, Tuerlinckx, F, & De Boeck, P. (2010). A general framework and an R package for the detection of dichotomous differential item functioning. Behavior Research Methods, 42, 847–862.

Zwick, R. (2012). A review of ETS differential item functioning assessment procedures: Flagging rules, minimum sample size requirements, and criterion refinement. Princeton, NJ: Educational Testing Service. https://files.eric.ed.gov/fulltext/EJ1109842.pdf

Some Equations and R Code for Examining Intersectionality in Differential Item Functioning Analysis

A couple of papers came out last year that consider intersectionality in differential item functioning (DIF) analysis. Russell and Kaplan (2021) introduced the idea, and demonstrated it with data from a state testing program. Then, Russell, Szendey, and Kaplan (2021) replicated the first study with more data. This is a neat application of DIF, and I’m surprised it hasn’t been explored until now. I’m sure we’ll see a flurry of papers on it in the next few years.

Side note, the second Russell study, published in Educational Assessment, doesn’t seem justified as a separate publication. They use the same DIF method as in the first paper, they appear to use the same data source, and they have similar findings. They also don’t address in the second study any of the limitations of the original study (e.g., they still use a single DIF method, don’t account for Type I error increase, don’t have access to item content, don’t have access to pilot vs operational items). The second study really just has more data.

Why is the intersectional approach neat? Because it can give us a more accurate understanding of potential item bias, to the extent that it captures a more realistic representation of the test taker experience.

The intersectional approach to DIF is a simple extension of the traditional approach, one that accounts for interactions among grouping variables. We can think of the traditional approach as focusing on main effects for distinct variables like gender (female compared with male) and race (Black compared with White). The intersectional approach simply interacts the grouping variables to examine the effects of membership in intersecting groups (e.g., Black female compared with White male).

Interaction DIF models

I like to organize DIF problems using explanatory item response theory (Rasch) models. In the base model, which assumes no DIF, the log-odds $\eta_{ij}$ of correct response on item $i$ for person $j$ can be expressed as a linear function of overall mean performance $\gamma_0$ plus mean performance on the item $\beta_{i}$ and the person $\theta_j$:

$$\eta_{ij} = \gamma_0 + \beta_i + \theta_j,$$

with $\beta$ estimated as a fixed effect and $\theta \sim \mathcal{N}(\gamma_0, \, \sigma^{2})$. $\gamma_0 + \beta_i$ captures item difficulty, with higher values indicating easier items.

Before we formulate DIF, we estimate a shift in mean performance by group:

$$\eta_{ij} = \gamma_0 + \gamma_{1}group_j + \beta_i + \theta_j.$$

In a simple dichotomous comparison, we can use indicator coding in $group$, where the reference group is coded as 0 and the focal group as 1. Then, $\gamma_0$ estimates the mean performance for the reference group and $\gamma_1$ is the impact or disparity for the focal group expressed as a difference from $\gamma_0$. To estimate DIF, we interact group with item:

$$\eta_{ij} = \gamma_0 + \gamma_{1}group_j + \beta_{0i} + \beta_{1i}group_j + \theta_j.$$

Now, $\beta_{0i}$ is the item difficulty estimate for the reference group and $\beta_{1i}$ is the DIF effect, expressed as a difference in performance on item $i$ for the focal group, controlling for $\theta$.

The previous equation captures the traditional DIF approach. Separate models would be estimated, for example, with gender in one model and then race/ethnicity in another. The interaction effect DIF approach consolidates terms into a single model with multiple grouping variables. Here, we replace $group$ with $f_j$ for female and $b_j$ for Black:

$$\eta_{ij} = \gamma_0 + \gamma_{1}f_j + \gamma_{2}b_j + \gamma_{3}f_{j}b_j + \beta_{0i} + \beta_{1i}f_j + \beta_{2i}b_j + \beta_{3i}f_{j}b_j + \theta_j.$$

With multiple grouping variables, again using indicator coding, $\gamma_0$ estimates the mean performance for the reference group White male and $\gamma_{1}$, $\gamma_{2}$, and $\gamma_3$ are the deviations in mean performance for White women, Black men, and Black women, respectively, from the reference group. The $\beta$ terms are interpreted similarly but in reference to performance on item $i$, with $\beta_1$, $\beta_2$, and $\beta_3$ as DIF effects.

R code

Here’s what the above models look like when translated to lme4 (Bates et al, 2015) notation in R.

# lme4 code for running interaction effect DIF via explanatory Rasch
# modeling, via generalized linear mixed model
# family specifies the binomial/logit link function
# data_long would contain scores in a long/tall/stacked format
# with one row per person per item response
# item, person, f, and b are then separate columns in data_long

# Base model
glmer(score ~ 1 + item + (1 | person),
  family = "binomial", data = data_long)

# Gender DIF with main effects
glmer(score ~ 1 + f + item + f:item + (1 | person),
  family = "binomial", data = data_long)

# Race/ethnicity DIF with main effects
glmer(score ~ 1 + b + item + b:item + (1 | person),
  family = "binomial", data = data_long)

# Gender and race/ethnicity DIF with interaction effects
glmer(score ~ 1 + f + b + item + f:b + f:item + b:item + f:b:item + (1 | person),
  family = "binomial", data = data_long)

# Shortcut for writing out the same formula as the previous model
# This notation will automatically create all main effects and
# 2x and 3x interactions
glmer(score ~ 1 + f * b * item + (1 | person),
  family = "binomial", data = data_long)

In my experience, modeling fixed effects for items like this is challenging in lme4 (slow, with convergence issues). Random effects for items would simplify things, but we would have to adopt a different theoretical perspective, where we’re less interested in specific items and more interested in DIF effects, and the intersectional experience, overall.

Here’s what the code looks like with random effects for items and persons. In place of DIF effects, this will produce variances for each DIF term, which tell us how variable the DIF effects are across items by group.

# Gender and race/ethnicity DIF with interaction effects
# Random effects for items and persons
glmer(score ~ 1 + f + b + f:b + (1 + f + b + f:b | item) + (1 | person),
  family = "binomial", data = data_long)

# Alternatively
glmer(score ~ 1 + f * b + (1 + f * b | item) + (1 | person),
  family = "binomial", data = data_long)

While lme4 provides a flexible framework for explanatory Rasch modeling (Doran et al, 2007), DIF analysis gets complicated when we consider anchoring, which I’ve ignored in the equations and code above. In practice, ideally, our IRT model would include a subset of items where we are confident that DIF is negligible. These items anchor our scale and provide a reference point for comparing performance on the potentially problematic items.

The mirt R package (Chalmers, 2012) has a lot of nice features for conducting DIF analysis via IRT. Here’s how we get at main effects and interaction effects DIF using mirt:::multipleGroup and mirt:::DIF. The former runs the model and the latter reruns it, testing the significance of the multi group extension by item.

# mirt code for interaction effect DIF

# Estimate the multi group Rasch model
# Here, data_wide is a data frame containing scored item responses in
# columns, one per item
# group_var is a vector of main effect or interacting group values,
# one per person (e.g., "fh" and "mw" for female-hispanic and male-white)
# anchor_items is a vector of item names, matching columns in data_wide,
# for the items that are not expected to vary by group, these will
# anchor the scale prior to DIF analysis
# See the mirt help files for more info
mirt_mg_out <- multipleGroup(data_wide, model = 1, itemtype = "Rasch",
  group = group_var,
  invariance = c(anchor_items, "free_means", "free_variances"))

# Run likelihood ratio DIF analysis
# For each item, the original model is fit with and without the
# grouping variable specified as an interaction with item
# Output will then specify whether inclusion of the grouping variable
# improved model fit per item
# items2test identifies the columns for DIF analysis
# Apparently, items2test has to be a numeric index, I can't get a vector
# of item names to work, so these would be the non-anchor columns in
# data_wide
mirt_dif_out <- DIF(mirt_mg_out, "d", items2test = dif_items)

One downside to the current setup of mirt:::multipleGroup and mirt:::DIF is there isn’t an easy way to iterate through separate focal groups. The code above will test the effects of the grouping variable all at once. So, we’d have to run this separately for each dichotomous comparison (e.g., subsetting the data to Hispanic female vs White male, then Black female vs White male, etc) if we want tests by focal group.

Of course, interaction effects DIF can also be analyzed outside of IRT (e.g., with the Mantel-Haenszel method). It simply involves more comparisons per item than with the main effect approach where we consider each grouping variable separately. For example, gender (with two levels, female, male) and race (with three levels, Black, Hispanic, White) gives us 3 comparisons per item with main effects, whereas we have 5 comparisons per item with interaction effects.

After writing up all this example code, I’m realizing it would be much more useful if I demonstrated it with output. I try to round up some data and share results in a future post.

References

Bates, Douglas, Martin Mächler, Ben Bolker, and Steve Walker. 2015. Fitting Linear Mixed-Effects Models Using lme4. Journal of Statistical Software 67 (1): 1–48.

Chalmers, R. P. (2012). mirt: A multidimensional item response theory package for the R environment. Journal of Statistical Software, 48, 1–29.

Doran, H., D. Bates, P. Bliese, and M. Dowling. 2007. Estimating the Multilevel Rasch Model: With the lme4 Package. Journal of Statistical Software 20 (2): 1–18.

Russell, M., & Kaplan, L. (2021). An intersectional approach to differential item functioning: Reflecting configurations of inequality. Practical Assessment, Research & Evaluation26(21), 1–17.

Russell, M., Szendey, O., & Kaplan, L. (2021). An intersectional approach to DIF: Do initial findings hold across tests? Educational Assessment26, 284–298.