In class last fall, we reviewed the Smarter Balanced (SB) technical report for examples of how validity evidence is collected and documented, including through differential item functioning (DIF) analysis.
I teach and research DIF, but I don’t often inspect operational results from a large-scale standardized test. Results for race/ethnicity showed a few unexpected trends. Here’s a link to the DIF section of the 2018/2019 technical report.
The report gives an overview of the Mantel-Haenszel method, and then shows, for ELA/literacy and math, numbers of items from the test bank per grade and demographic variable that fall under each DIF category.
- The NA category is for items that didn’t have enough valid responses, for a given comparison (eg, female vs male), to estimate DIF. Groups with smaller sample sizes had more items with NA.
- A, B, C are the usual Mantel-Haenszel levels of DIF, where A is negligible, B is moderate, and C is large. Testing programs, including SB, focus on items at level C and mostly leave A and B alone.
- The +/- indicates the direction of the DIF, where negative is for items that favor the reference group (eg, male) or disadvantage the focal group (eg, female), and positive is for items that do the opposite, favor the focal group or disadvantage the reference group.
The SB report suggests that DIF was conducted at the field test stage, where items weren’t yet operational. But the results tables say “DIF items in the current summative pool,” which makes it sound like they include operational items. I’m not sure how this worked.
ELA
Here’s a bar chart that summarizes level C DIF by grade for ELA in a subset of demographic comparisons. The blueish bars going up are percentages of items with C+ DIF (favoring focal group) and the redish bars going down are for C- (favoring reference). The groups being compared are labeled on the right side.
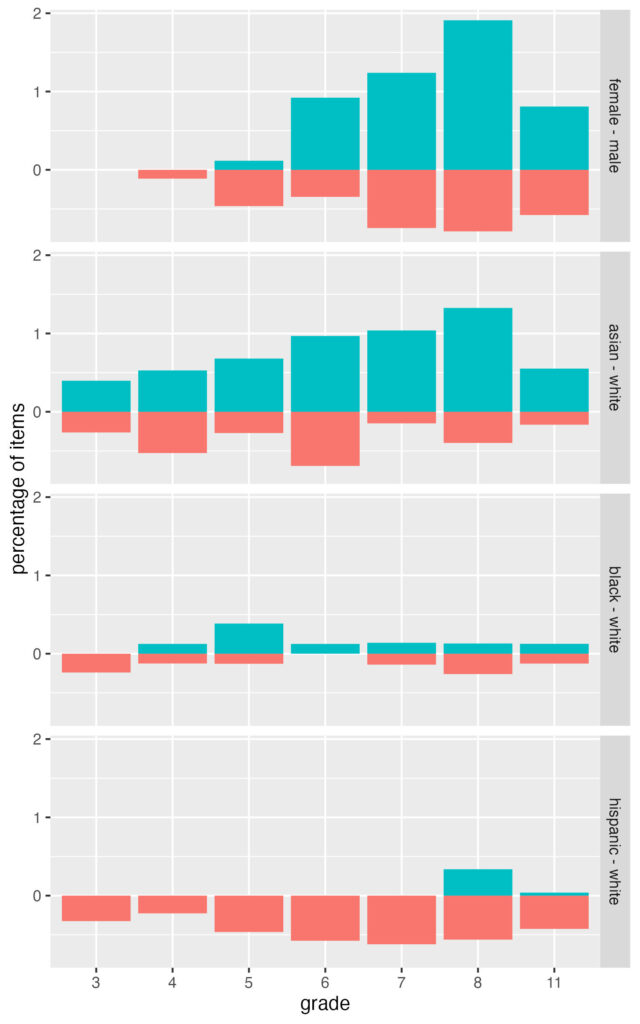
I’m using percentages instead of counts of items because the number of items differs by grade (under 1,000 in early grades, over 2,000 in grade 11), and the number of items with data for DIF analysis varies by demographic group (some groups had more NA than others). Counts would be more difficult to compare. These percentages exclude items in the NA category.
For ELA, we tend to see more items favoring female (vs male) and asian (vs white) students. There doesn’t seem to be a trend for black and white students, but there are more items favoring white students when compared with hispanic (almost none). In some groups, we also see a slight increase for later grades, but a decrease at grade 11.
Math
Here’s the same chart but for math items. Note the change in y-axis (now maxing at 4 percent instead of 2 for ELA) to accommodate the increase in DIF favoring asian students (vs white). Other differences from ELA include slightly more items favoring male students (vs female), and more balance in results for black and white students, and hispanic and white students.
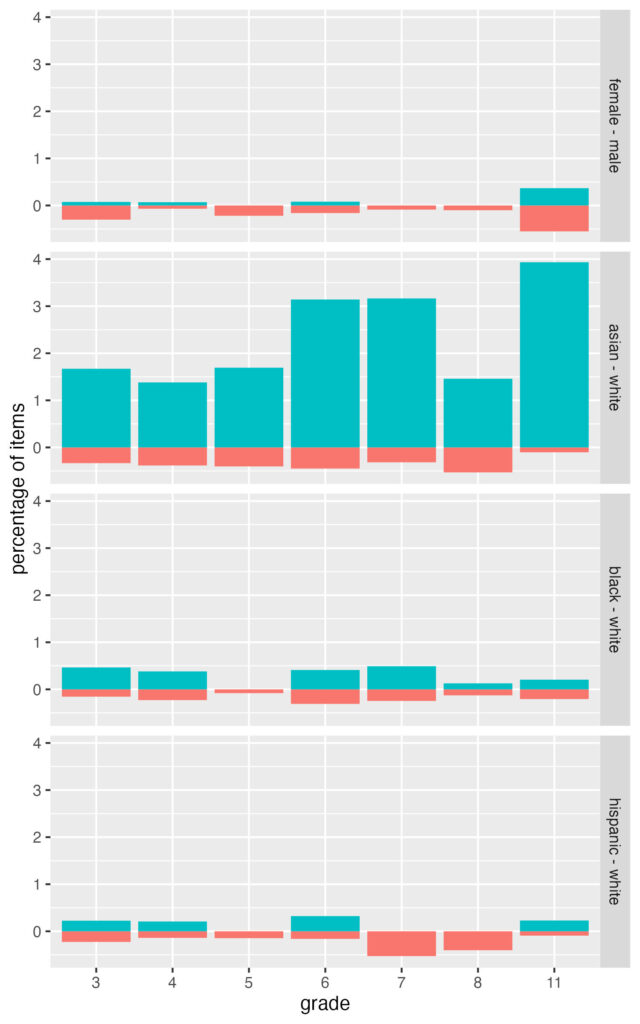
DIF in grades 6, 7, and 11 reaches 3 to 4% of items favoring asian students. Converting these back to counts, the total numbers of items with data for DIF analysis are 1,114, 948, and 966 in grades 6, 7, and 11, respectively, and the numbers of C+ DIF favoring asian students are 35, 30, and 38.
Conclusions
These DIF results are surprising, especially for the math test, but I’d want some more information before drawing conclusions.
First, what was the study design supporting the DIF analysis? The technical report doesn’t describe how and when data were collected. Within a given grade and demographic group, do these results accumulate data from different years and different geographic locations? If so, how were forms constructed and administered? Were field test items embedded within the operational adaptive test? And how were results then linked?
Clarifying the study design and scaling would help us understand why so many items had insufficient sample sizes for estimating DIF analysis, and why these item numbers in the NA category differed by grade and demographic group. Field test items are usually randomly assigned to test takers, which would help ensure numbers of respondents are balanced across items.
Finally, the report leaves out some key details on how the Mantel-Haenszel DIF analysis was conducted. We have the main equations, but we don’t have information about what anchor/control variable was used (eg, total score vs scale score), whether item purification was used, and how significance testing factored into determining the DIF categories.